TLDR
- Average goals for and Average goals against per league position improves ranking groups predictions
Digging deeper with regressions
In the previous article, the main finding was that:
- there doesn’t seem to be an obvious relationship between position and draws
Finding little is still a type of finding. At least it confirms that it is hard to predict for draws. This does mean I will here bring in some more abstract ways to drill below the surface.
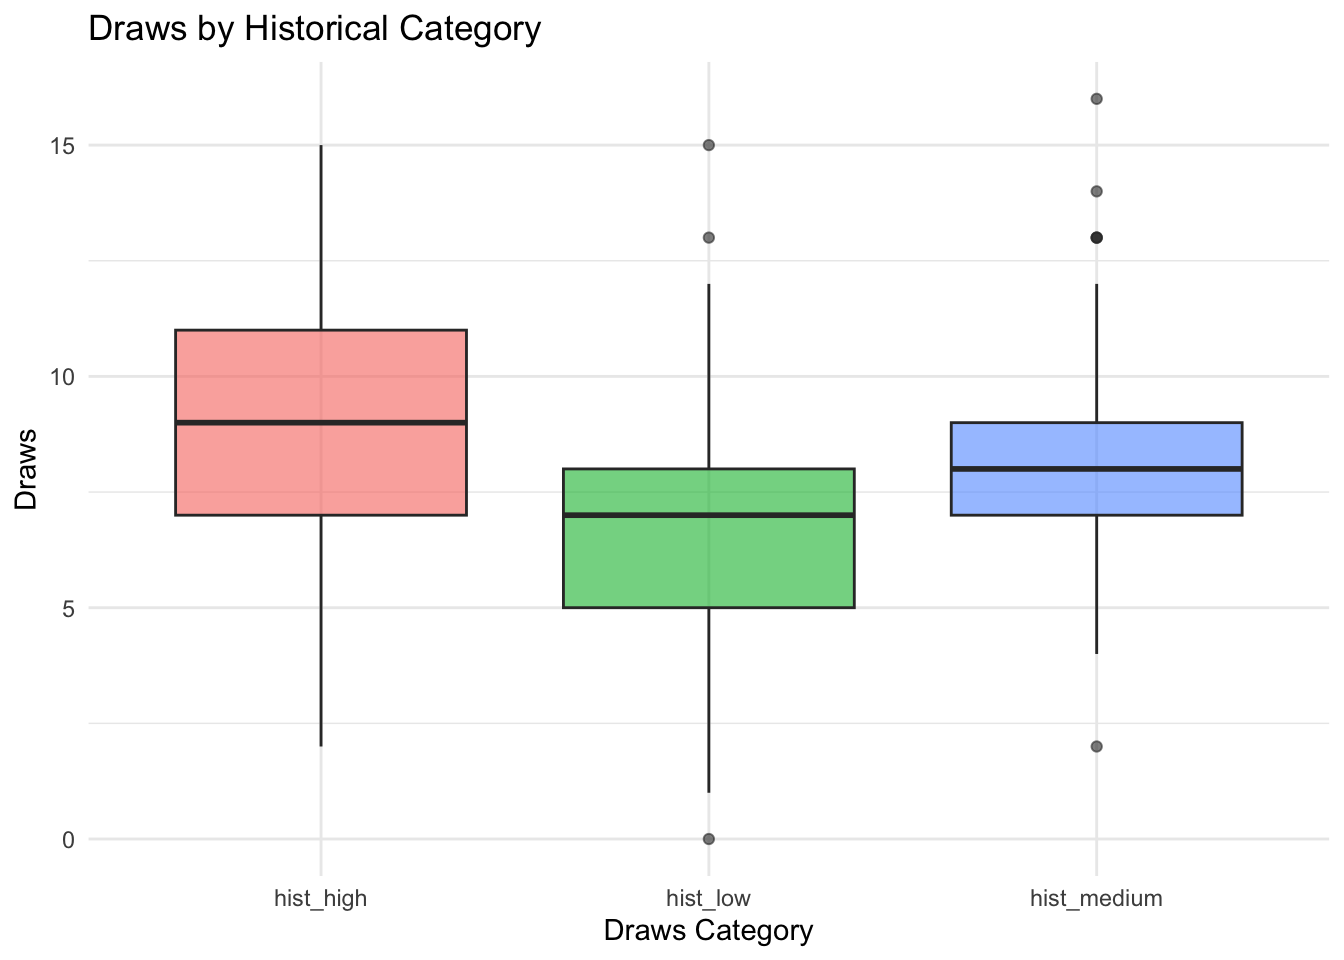
Call:
lm(formula = Draws ~ Draws_Category, data = snapshots_all_seasons_34_regr)

Residuals:
    Min      1Q  Median      3Q     Max
-6.8542 -1.7847 -0.1389  1.2153  8.2153

Coefficients:
                          Estimate Std. Error t value Pr(>|t|)
(Intercept)                 8.8542     0.1965  45.058  < 2e-16 ***
Draws_Categoryhist_low     -2.0694     0.2779  -7.447  5.3e-13 ***
Draws_Categoryhist_medium  -0.7153     0.2779  -2.574   0.0104 *
---
Signif. codes:  0 '***' 0.001 '**' 0.01 '*' 0.05 '.' 0.1 ' ' 1

Residual standard error: 2.358 on 429 degrees of freedom
Multiple R-squared:  0.1177,    Adjusted R-squared:  0.1136
F-statistic: 28.61 on 2 and 429 DF,  p-value: 2.176e-12
To drill down, I’ve done a regression above. I’m testing if the 3 categories (high, middle and low) have predictive power on the number of draws in the final round. So, what is the size of the effect of the 3 groups? And is the effect significant?
Random intercept model
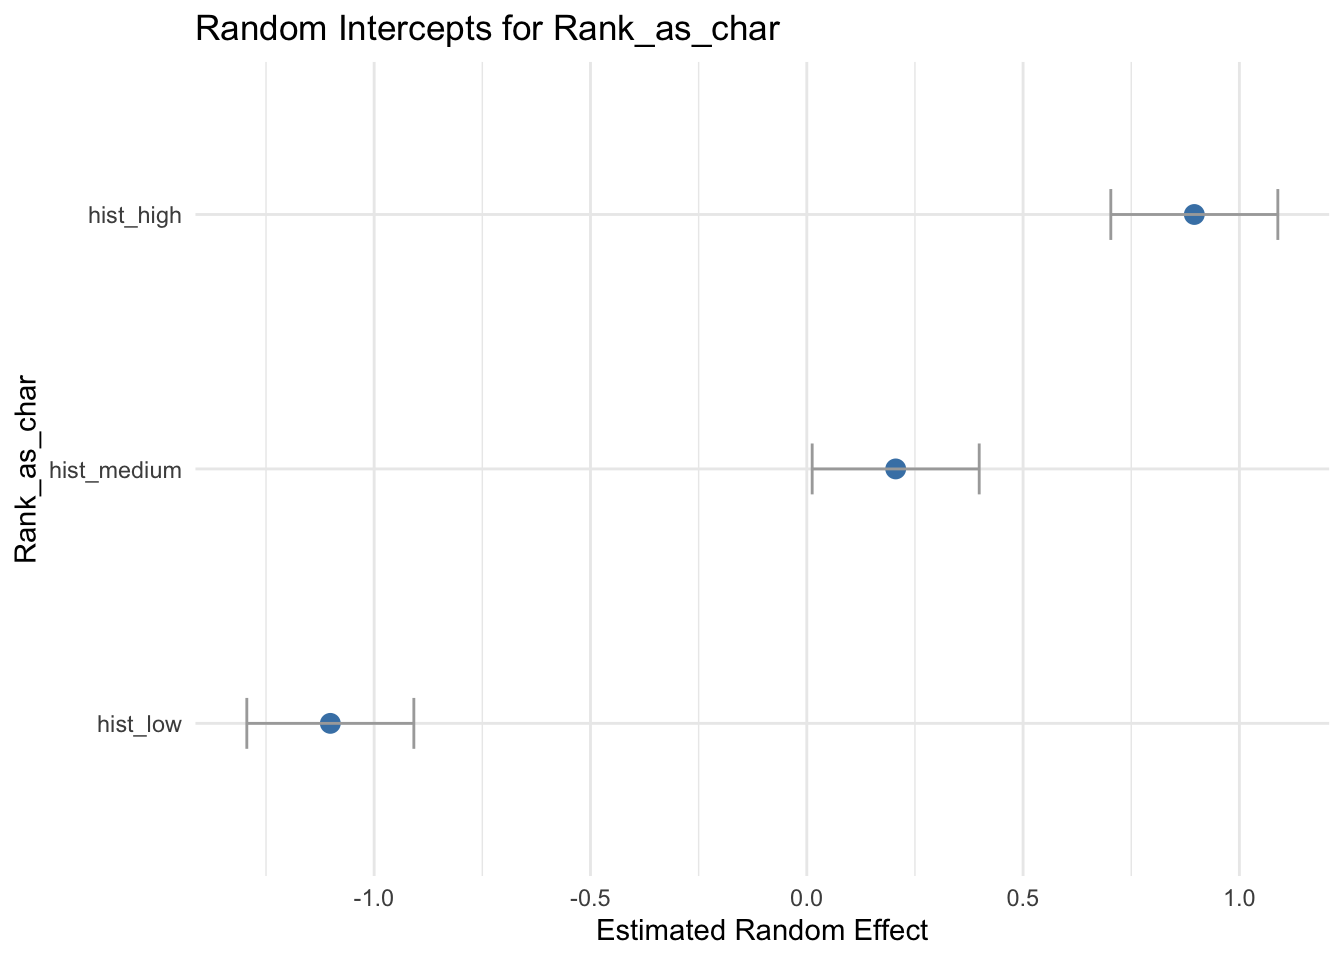
I want to test these 3 groups a bit more using a random intercept model. Such modeling lets me test the groups for different starting points (intercepts) due to being grouped. So how do the 3 categories model, if I consider them as random effects?
Loading required package: Matrix
Attaching package: 'Matrix'
The following objects are masked from 'package:tidyr':

    expand, pack, unpack
Linear mixed model fit by REML ['lmerMod']
Formula: Draws ~ (1 | Draws_Category)
   Data: snapshots_all_seasons_34_regr

REML criterion at convergence: 1975.4

Scaled residuals:
    Min      1Q  Median      3Q     Max
-2.8941 -0.7725 -0.0557  0.4997  3.4670

Random effects:
 Groups         Name        Variance Std.Dev.
 Draws_Category (Intercept) 1.066    1.032
 Residual                   5.561    2.358
Number of obs: 432, groups:  Draws_Category, 3

Fixed effects:
            Estimate Std. Error t value
(Intercept)   7.9259     0.6068   13.06
The following shows from using a random intercept for the 3 groups:
Grand mean = 7.93 draws
Differences between categories exist, but most variability is within categories
Categories explain about 16% of the variance in this model
This confirms that there’s some predictive truth to these categories. It does however require a model of a world where there are only categories of ranking and draws. This is far-removed from all the things that influence matches turning into a draw or not. There are many variables that are being left out of the model.
Average number of goals for and against
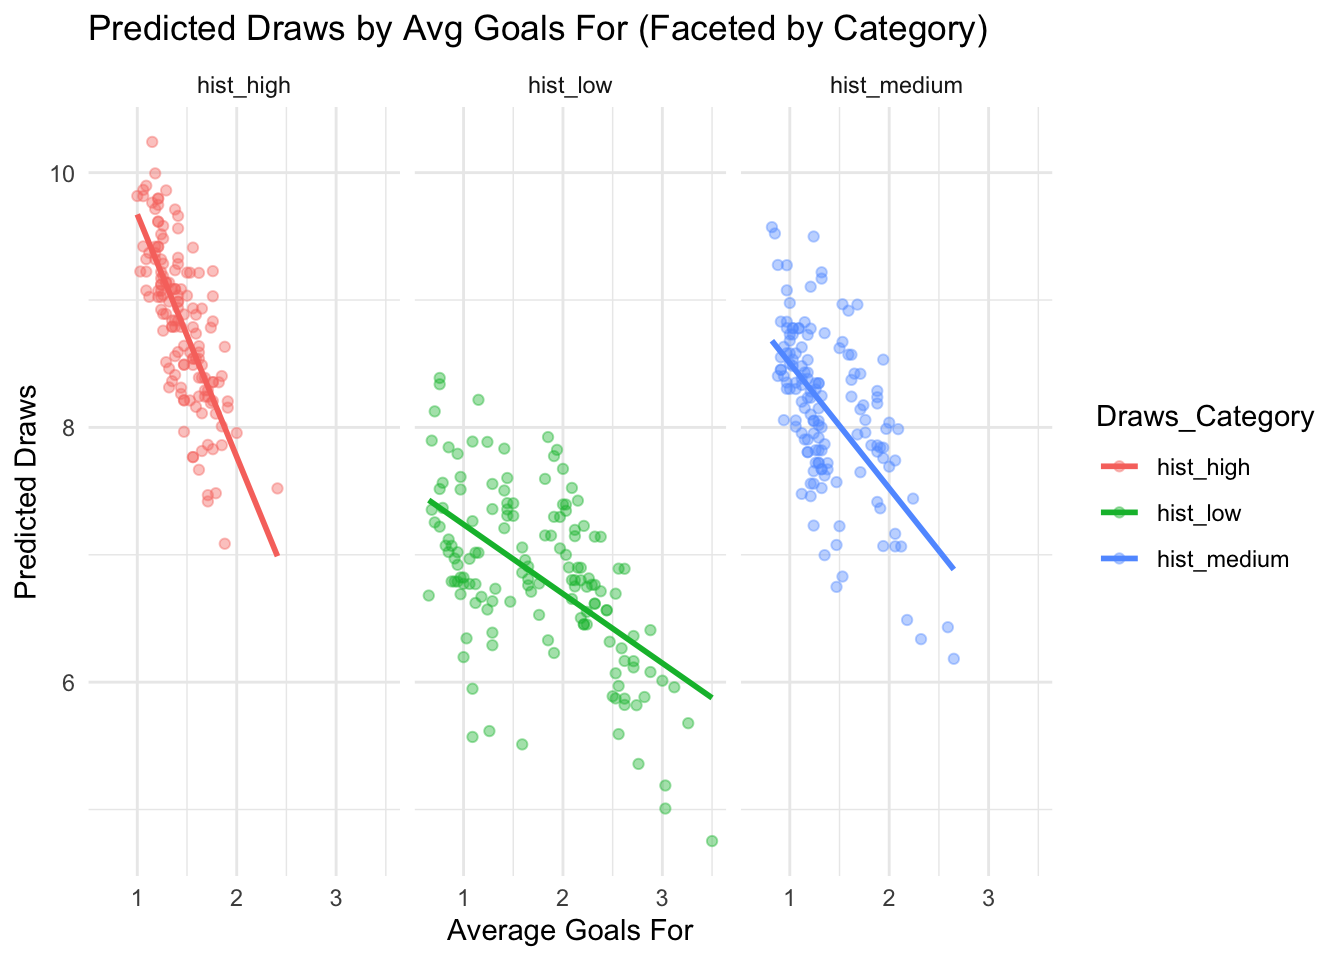
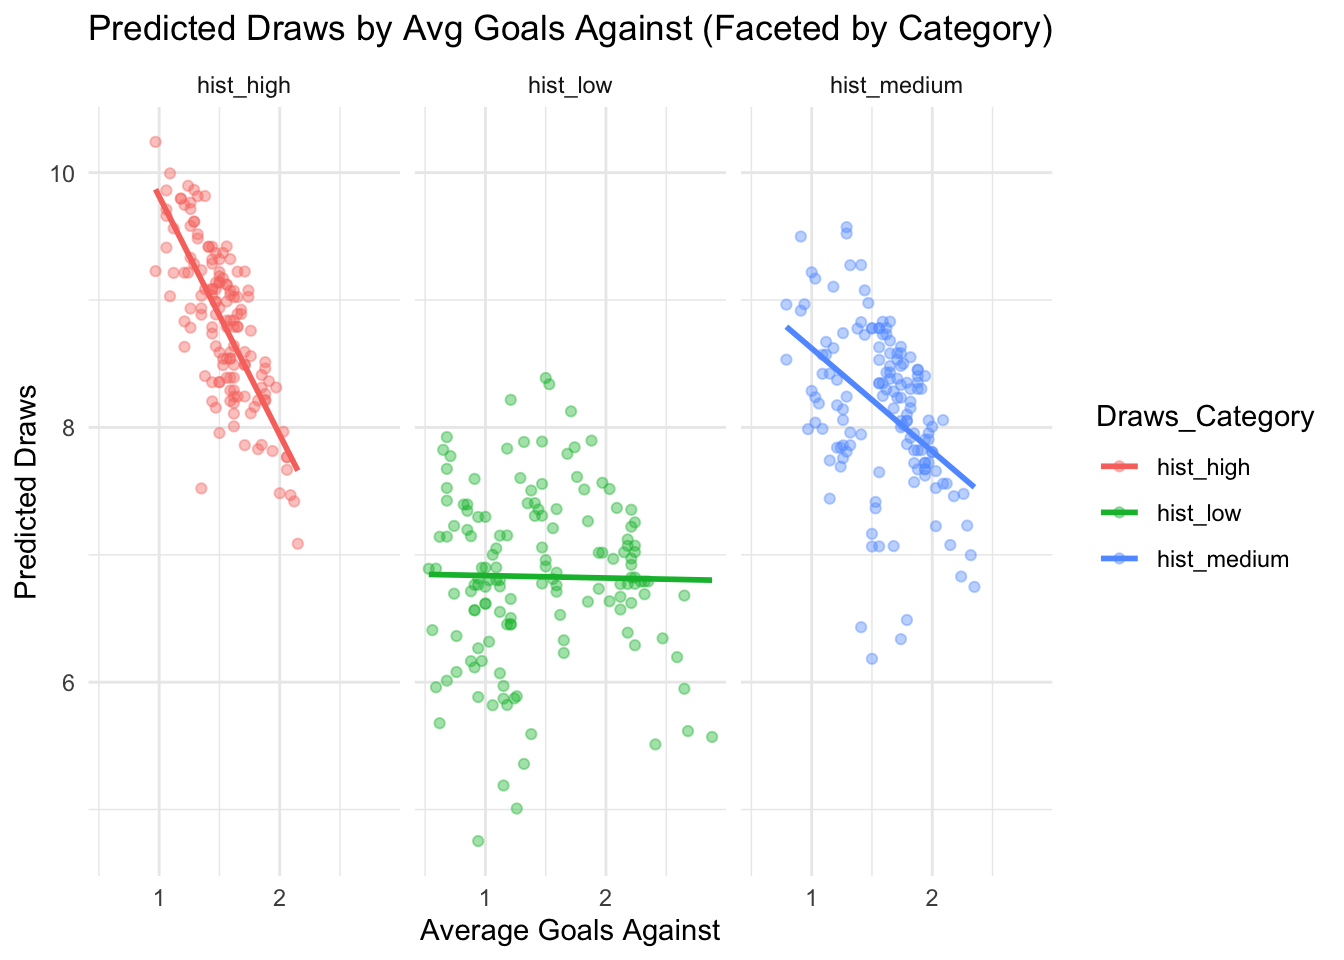
To take this a bit further, I want to see how these random effects play together with other variables. After all, draws don’t happen in a vacuum: they are the result of teams not creating a goal difference during the matches they play. So I want goals to enter the equation. Specifically, I will enter the average number of goals for and the average number of goals against (per league rank, per final round, per season) into the equation. My thinking is that the goal averages are indicators of a team’s ability to create or resist goal differences. I will combine these variables with the random effect of the 3 groups.
Linear mixed model fit by REML ['lmerMod']
Formula: Draws ~ Avg_Goals_For + Avg_Goals_Against + (1 | Draws_Category)
   Data: snapshots_all_seasons_34_regr

REML criterion at convergence: 1943.9

Scaled residuals:
    Min      1Q  Median      3Q     Max
-2.9825 -0.6549 -0.0702  0.5909  4.1675

Random effects:
 Groups         Name        Variance Std.Dev.
 Draws_Category (Intercept) 0.7058   0.8401
 Residual                   5.1840   2.2768
Number of obs: 432, groups:  Draws_Category, 3

Fixed effects:
                  Estimate Std. Error t value
(Intercept)        12.9752     1.0115  12.827
Avg_Goals_For      -1.6630     0.2960  -5.619
Avg_Goals_Against  -1.6446     0.3415  -4.816

Correlation of Fixed Effects:
            (Intr) Av_G_F
Avg_Gols_Fr -0.775
Avg_Gls_Agn -0.800  0.637
`geom_smooth()` using formula = 'y ~ x'
`geom_smooth()` using formula = 'y ~ x'
Great stuff. This model in short:
Both scoring more and conceding more reduces draws
Categories (Draws_Category) still matter, but their effect is small compared to scoring/conceding goals
The model fits better than a random-intercept-only model (REML criterion is lower than 1975.4 → 1943.9).
In football terms, this model confirms that teams with low scoring/conceding goals tend to draw more matches.
Conclusions
- Who does all the drawing?
- teams with low goals for or against
- positions 6, 7, 9, 10, 11, 12
- Is there a relationship between league ranking and drawing?
- there is, but it has limited predictive power
- significant (so no coincidence) but not a strong effect
- Limitations:
- this analysis focused very strongly on the final round
- opted for a rather myopic approach to focus on league position
- this was a starting point to test and experiment and therefore lacks rigor across the board